While I was designing and simulating the antenna, I found that the scattering parameters (S11) were giving unexpected results and not showing the correct frequency values.
After consulting with others who had used the software before I learned that, because the wavelength is so large at the frequency we are using - almost 15 metres, the antenna components are too electrically small to be simulated by the software.
I have decided that it is important to verify the concept of meanderline antennas however a higher frequency needs to be used.
In the initial project plan there was scope to investigate pulsars using the antenna and, as these work at much higher frequencies, I have decided that my concept antenna will focus on observing pulsars. I will therefore continue to design an antenna using the CST Microwave Studio software but aim for 400MHz - a common frequency for pulsars - in order to prove the concept.
Sunday, 25 November 2012
Thursday, 15 November 2012
Designing a New Antenna
As I mentioned in the previous post, I will be using the concept of Meanderline antennas to try and optimise the design for the antenna. The antenna needs to be designed first, and then simulated in the design software before it can be manufactured and tested.
I have started using the software CST Microwave studio and have worked through an antenna design tutorial in order to learn how the software works and its capabilities. The design itself will just be meandering the copper tracks until the antenna is the correct length for the frequency required - in this case 20.1 MHz.
The design will also incorporate a ground plane underneath to prevent the antenna receiving signals reflected from the roof of the department.
While I am designing I will be simulating the design to check that the Scattering Parameters (s-parameters) show the antenna working at the frequency we expect it to. The radiation patterns will also be checked to ensure that the design is initially omnidirectional and that the ground plane is preventing signals from below reach the antenna.
Wednesday, 31 October 2012
A New Project Proposal
For the first part of the project I was aiming to replicate the results obtained last year during testing.

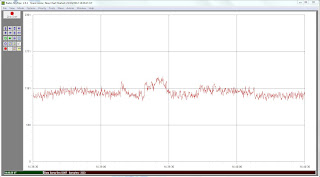
The first part of the signal looks like it could be valid solar flare data. However, when the signal levels in the area circled, are compared with a noise signal (shown below) it is not certain whether real data is being measured or the system is just receiving noise.

The diagram above shows the noise floor signal obtained from the equipment when the antenna is unplugged. As the y axis values show, the signal is close to the values seen for the noise signal. This indicates that the signal is weak. There are a few different reasons why this may be the case which will now be explored.
The design is far from being optimal:
- The antenna may not be tuned correctly
- This will cause losses
- The radiation pattern may not be pointing skywards
- This will cause a weaker signal to be received
- The antenna may be receiving reflected signals from the roof
- The NASA recommended design is far too large for the department roof
The solution to these problems is to build a new antenna for the radio telescope with the aim of being able to obtain better quality signals using a Meanderline antenna.
A Meanderline antenna works by having the same electrical length as a dipole antenna but reducing the overall size so that the antenna would not have to be 7 metres long but could be made smaller instead as shown in the diagram below.

Rather than use a 7 metre long dipole antenna as NASA suggest, in this project I will be investigating whether it is possible to use a Meanderline antenna. The concept of Meanderline antennas is comparatively new so the simulations will help to validate the theory.
Saturday, 20 October 2012
Initial Testing
The equipment (shown below) has been set up in the lab again and I have been testing the antenna.

The results from the Radio SkyPipe graphs I have seen look similar to those collected last year which is encouraging as the equipment is unchanged. Below are some interesting patterns in the resulting graphs.


The results from the Radio SkyPipe graphs I have seen look similar to those collected last year which is encouraging as the equipment is unchanged. Below are some interesting patterns in the resulting graphs.


Wednesday, 10 October 2012
Continuing the Project
It has been decided that the project should continue for another year with the aim of being able to obtain more information.
As the group from last year have all now graduated, the project is being taken over by myself (I'm Grace, a final year MEng student in electrical engineering and electronics).
Initially the aim is to replicate the results that the group saw last year myself and then to take the project further by either changing the design or to collect more data than last year and analyse it further. One possible route for the project to follow is to use it to observe a pulsar.
A pulsar (portmanteau of pulsating star) is a highly magnetized, rotating neutron star that emits a beam of electromagnetic radiation - from Wikipedia
Thursday, 22 March 2012
Solar Storm - The Threat to Planet Earth
Here is a very interesting video broadcasted on BBC in March which is related to our project.
There is a new kind of weather to worry about, which comes from our nearest star, the sun.
Scientists are expecting a fit of violent activity on the sun which will propel billions of tonnes of superheated gas and pulses of energy towards our planet.
They have the power to close down our modern technological civilisation - e.g. in 1989, a solar storm cut off the power to the Canadian city of Quebec.
This video explained how solar burst happens and what the effect it will cause.

Courtesy by BBC Horizon: http://www.bbc.co.uk/i/b01d99vb/
Tuesday, 20 March 2012
16/Mar/2012 Record for Sun

The Chart above shows the data we have received from about 12 o'clock to 13:30. It is the best period for us to detect the solar burst in Liverpool.
During this process, we have got some classical wave forms for solar burst, which has been shown in the circles.
Thursday, 15 March 2012
Type III Solar Burst

Rapidly drift from high to low frequencies. May exhibit harmonics.
Often accompany the flash phase of large flares.
The chart above was taken from the Winward Community College Jupiter Observatory receiver at 20.1 mHz on September 20, 2000. The times are local Hawaiian time so add 10 hours for UT. The burst is believed to be about 18 dB above the galactic background.
Type II Solar Burst

Slow drift from high to slow frequencies.
The stripchart above was captured at the new Jupiter Observatory at Windward Community College on the Island of Oahu in Hawaii on July 28, 2000. The receiver is one of Dick Flagg's Jove Receivers attached to the standard in-phase version of the dual dipole Jove antenna. Primary beam pattern is to the zenith. The frequency is approximately 20.1 Mhz.
Saturday, 10 March 2012
Solar Burst on Skypipe
Solar Bursts can always be detected at the frequency about 20 MHz. The common characteristic is turn on rapidly and decay slowly.

Here is the examples received by from NASA’s Radio JOVE Project.

Here is the examples received by from NASA’s Radio JOVE Project.
But, actually, the solar burst can be classified into 5 kinds.
Type I Short, narrow band events that usually occur in great numbers
together with a broader band continuum. May last for hours or days.
Type II Slow drift from high to low frequencies. Often show fundamental
and second harmonic frequency structure.
Type III Rapidly drift from high to low frequencies. May exhibit harmonics.
Often accompany the flash phase of large flares.
Type IV Flare-related broad-band continua.
Type V Broad-band continua which may appear with III bursts. Last 1 to 2
minutes, with duration increasing as frequency decreases.
Thursday, 8 March 2012
Solar Burst
Solar Burst stands for all the burst happened on the
surface of the Sun, such as Sunspots and Solar Flares.
Because of the varying rotational speed of the Sun,
there are some regions with intense localized magnetic lines which named
Sunspots. As the Sun is a gas ball, the rotate speed on the equator seems
faster than the speed on the poles. Therefore, the magnetic field lines are
dragged together and twisted which always run independently from pole to pole. The
flux lines pushed by hot gases break through to the Sun’s surface. And the
distorted field lines slows down rising convection currents, which causing the
region to cool. The dark spots in the bottom video are the cooler areas
comparing to the hotter surroundings.
The Solar Flare is defined as a sudden burst on the
surface of the Sun. (John D. Kraus, 1986) Most flares appear in solar active
regions, for instance, near the sunspots, where the magnetic field lines on the
surface of the Sun beyond the corona. The energy for solar flare mainly comes
from the magnetic energy released by corona. During the solar flare appearing,
there is a sudden increase in brightness can be observed, the flux of radio
waves, ultraviolet and X-ray will soar and sometimes high-energy γ-ray
or charged particles will be emitted too.
Wednesday, 7 March 2012
Radio Telescope
As a very fast development in Radio astronomy, a subfield of astronomy which studies celestial objects at radio frequencies, radio telescope was invented in a form on directional radio antenna.
In their astronomical role they differ from optical telescopes in that they operate in the radio frequency portion of the electromagnetic spectrum where they can detect and collect data on radio sources.
In 1931, Karl Guthe Jansky, an engineer with Bell Telephone Laboratories, built the first radio antenna which can identify an astronomical radio source. This kind of telescope is basically a very sensitive radio receiver.
Comparing to the communication receivers which are used to extract information and have been intentionally modulated onto the radio wave, radio telescope receivers are designed to measure the intensity of the radio wave over some limited band of frequencies. Therefore, the radio telescope can be seen as an energy measuring device.


The two figures above show the whole system of simple radio telescope. And this is also the system our group used to detect the space.
Subscribe to:
Comments (Atom)