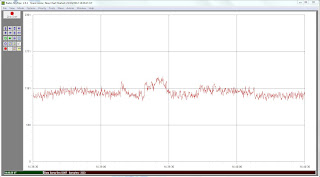
For the first part of the project I was aiming to replicate the results obtained last year during testing.
The first part of the signal looks like it could be valid solar flare data. However, when the signal levels in the area circled, are compared with a noise signal (shown below) it is not certain whether real data is being measured or the system is just receiving noise.
The diagram above shows the noise floor signal obtained from the equipment when the antenna is unplugged. As the y axis values show, the signal is close to the values seen for the noise signal. This indicates that the signal is weak. There are a few different reasons why this may be the case which will now be explored.
The design is far from being optimal:
- The antenna may not be tuned correctly
- This will cause losses
- The radiation pattern may not be pointing skywards
- This will cause a weaker signal to be received
- The antenna may be receiving reflected signals from the roof
- The NASA recommended design is far too large for the department roof
The solution to these problems is to build a new antenna for the radio telescope with the aim of being able to obtain better quality signals using a Meanderline antenna.
A Meanderline antenna works by having the same electrical length as a dipole antenna but reducing the overall size so that the antenna would not have to be 7 metres long but could be made smaller instead as shown in the diagram below.
Rather than use a 7 metre long dipole antenna as NASA suggest, in this project I will be investigating whether it is possible to use a Meanderline antenna. The concept of Meanderline antennas is comparatively new so the simulations will help to validate the theory.


